
TechBlog
[Kaggle/python] PUBG 배틀그라운드 게임 데이터 분석 본문
📌 주제
📖 순서
1. 주제 정의
2. 게임 설명
3. 활용 데이터 및 변수
4. 자료 분석 과정
1. 주제 정의
- 주제: PUBG 배틀그라운드 게임 데이터 분석
- 요약: PUBG Developer에서 공개한 배틀그라운드 데이터를 활용한 분석 프로젝트를 진행했습니다.
- 분석 내용: EDA, 전처리, 시각화를 위주로 분석을 진행했고, 플레이어 등급의 최종 배치를 예측하는 RandomForest 모델도 basic하게 만들어보았습니다.
2. 게임 설명
📖 게임 개요
배틀그라운드는 플레이어가 돌아다니면서 무기, 총알, 방어구, 구급약 등을 수집하고 서로 죽이며 최후까지 살아남는 게임입니다. 게임 시작 시 플레이어들은 비행기에 탄 상태이며, 각자 원하는 위치에 낙하한 후 파밍(아이템을 줍는 행위)을 통해 싸움을 위한 준비를 합니다. 게임에서 승리하기 위한 전략으로는 크게 1) 소극적 전략(건물에 숨어서 적을 죽임), 2) 적극적 전략(돌격을 통해 빠르게 적을 죽임)이 있습니다.
🚷 게임 규칙
- 각 경기(matchId)에는 최대 100명의 플레이어가 참가할 수 있습니다.
- 한 경기 내에서 최대 4명의 플레이어가 같은 그룹에 포함될 수 있습니다.
⚠️ 주의할 점
데이터 확인 결과, 한 경기 내에서 groupId가 같은 플레이어가 4명 이상인 경우가 존재했습니다. Kaggle notebook에서 참고한 바로는, 이는 게임에서 연결이 끊기기 때문에 발생하는 현상이라고 합니다. 여러 그룹의 플레이어가 API의 데이터베이스에 동일한 최종 배치를 가진 것으로 저장되기 때문입니다. 따라서 우리는 groupId를 확실히 함께한 팀이 아니라 동일한 최종 순위를 가진 플레이어라고 생각해야 합니다.
2. 활용 데이터 및 변수
(1) 활용 데이터
▶ train 데이터(.csv)
- Rows X Columns: 4446966 X 29
- 각 행은 플레이어 한 명의 게임(match) 통계를 나타냄
- Target variable: 플레이어 등급의 최종 배치(winPlacePerc)
(2) 활용 데이터 출처
▶ Kaggle - PUBG Finish Placement Prediction (Kernels Only)
(3) 활용 변수
| Data fields | Details |
| DBNOs | Number of enemy players knocked |
| assists | Number of enemy players this player damaged that were killed by teammates. |
| boosts | Number of boost items used. |
| damageDealt | Total damage dealt. Note: Self inflicted damage is subtracted. |
| headshotKills | Number of enemy players killed with headshots. |
| heals | Number of healing items used. |
| Id | Player’s Id |
| killPlace | Ranking in match of number of enemy players killed. |
| killPoints | Kills-based external ranking of player. (Think of this as an Elo ranking where only kills matter.) If there is a value other than -1 in rankPoints, then any 0 in killPoints should be treated as a “None”. |
| killStreaks | Max number of enemy players killed in a short amount of time. |
| kills | Number of enemy players killed. |
| longestKill | Longest distance between player and player killed at time of death. This may be misleading, as downing a player and driving away may lead to a large longestKill stat. |
| matchDuration | Duration of match in seconds. |
| matchId | ID to identify match. There are no matches that are in both the training and testing set. |
| matchType | String identifying the game mode that the data comes from. The standard modes are “solo”, “duo”, “squad”, “solo-fpp”, “duo-fpp”, and “squad-fpp”; other modes are from events or custom matches. |
| rankPoints | Elo-like ranking of player. This ranking is inconsistent and is being deprecated in the API’s next version, so use with caution. Value of -1 takes place of “None”. |
| revives | Number of times this player revived teammates. |
| rideDistance | Total distance traveled in vehicles measured in meters. |
| roadKills | Number of kills while in a vehicle. |
| swimDistance | Total distance traveled by swimming measured in meters. |
| teamKills | Number of times this player killed a teammate. |
| vehicleDestroy | Number of vehicles destroyed. |
| walkDistance | Total distance traveled on foot measured in meters. |
| weaponsAcquired | Number of weapons picked up. |
| winPoints | Win-based external ranking of player. (Think of this as an Elo ranking where only winning matters.) If there is a value other than -1 in rankPoints, then any 0 in winPoints should be treated as a “None”. |
| groupId | ID to identify a group within a match. If the same group of players plays in different matches, they will have a different groupId each time. |
| numGroups | Number of groups we have data for in the match. |
| maxPlace | Worst placement we have data for in the match. This may not match with numGroups, as sometimes the data skips over placements. |
| winPlacePerc | The target of prediction. This is a percentile winning placement, where 1 corresponds to 1st place, and 0 corresponds to last place in the match. It is calculated off of maxPlace, not numGroups, so it is possible to have missing chunks in a match. |
4. 자료 분석 과정
(1) 기본 세팅
⚡ 필요한 라이브러리 불러오기
import numpy as np
import pandas as pd
import seaborn as sns
import matplotlib.pyplot as plt
%matplotlib inline

plt.rcParams['axes.unicode_minus'] = False
plt.rcParams['font.family'] = "Malgun Gothic"
plt.rcParams['axes.grid'] = False

color = sns.color_palette()
plt.style.use("fivethirtyeight")
import matplotlib.font_manager as fm
parameters = {'axes.labelsize': 10,
'axes.titlesize': 15,
'figure.titlesize': 17,
'xtick.labelsize': 11,
'ytick.labelsize': 14,
'legend.fontsize': 12,
'legend.title_fontsize': 13}
plt.rcParams.update(parameters)
import warnings
warnings.filterwarnings('ignore')
(2) 데이터 살펴보기
⚡ 데이터 불러오기
## train 데이터 로드
train = pd.read_csv("./PUBG_train_V2.csv")
⚡ 데이터 확인하기
## 데이터 확인
train.head()
⚡ 행, 열 개수와 결측치 존재 여부 확인하기
## 행/열 확인
print(train.shape)
# 컬럼별 결측치 개수 확인
print(train.isnull().sum())
# 출력 결과
(4446966, 29)
Id                 0
groupId            0
matchId            0
assists            0
boosts             0
damageDealt        0
DBNOs              0
headshotKills      0
heals              0
killPlace          0
killPoints         0
kills              0
killStreaks        0
longestKill        0
matchDuration      0
matchType          0
maxPlace           0
numGroups          0
rankPoints         0
revives            0
rideDistance       0
roadKills          0
swimDistance       0
teamKills          0
vehicleDestroys    0
walkDistance       0
weaponsAcquired    0
winPoints          0
winPlacePerc       1
dtype: int64
⚡ 메모리 최적화하기
## 메모리 최적화하기
# Memory saving function credit to https://www.kaggle.com/gemartin/load-data-reduce-memory-usage
def reduce_mem_usage(df):
    """ iterate through all the columns of a dataframe and modify the data type
        to reduce memory usage.
    """
    #start_mem = df.memory_usage().sum() / 1024**2
    #print('Memory usage of dataframe is {:.2f} MB'.format(start_mem))

    for col in df.columns:
        col_type = df[col].dtype

        if col_type != object:
            c_min = df[col].min()
            c_max = df[col].max()
            if str(col_type)[:3] == 'int':
                if c_min > np.iinfo(np.int8).min and c_max < np.iinfo(np.int8).max:
                    df[col] = df[col].astype(np.int8)
                elif c_min > np.iinfo(np.int16).min and c_max < np.iinfo(np.int16).max:
                    df[col] = df[col].astype(np.int16)
                elif c_min > np.iinfo(np.int32).min and c_max < np.iinfo(np.int32).max:
                    df[col] = df[col].astype(np.int32)
                elif c_min > np.iinfo(np.int64).min and c_max < np.iinfo(np.int64).max:
                    df[col] = df[col].astype(np.int64)
            else:
                if c_min > np.finfo(np.float16).min and c_max < np.finfo(np.float16).max:
                    df[col] = df[col].astype(np.float16)
                elif c_min > np.finfo(np.float32).min and c_max < np.finfo(np.float32).max:
                    df[col] = df[col].astype(np.float32)
                else:
                    df[col] = df[col].astype(np.float64)

    #end_mem = df.memory_usage().sum() / 1024**2
    #print('Memory usage after optimization is: {:.2f} MB'.format(end_mem))
    #print('Decreased by {:.1f}%'.format(100 * (start_mem - end_mem) / start_mem))

    return df
train = reduce_mem_usage(train)
(3) 분포 확인하기
⚡ 변수별 Plot
- 변수별 Plot을 확인해본 결과, "Kill", "longestKill", "walkDistance", "rideDistance", "swimDistance" 등 target 변수에 유의미한 영향을 줄 것으로 예상되는 변수들의 분포 불균형이 심한 것으로 판단됨
- 따라서 해당 변수들에 대해 이상치 제거 필요
✏️ 플레이어들의 Kill 횟수 분포
## 플레이어들의 Kill 횟수 분포
plt.figure(figsize=(12,4))
sns.countplot(x='kills', data=train)
plt.title('플레이어들의 kills 횟수')
plt.show()

print("\n", "kills 횟수 평균:", train['kills'].mean())
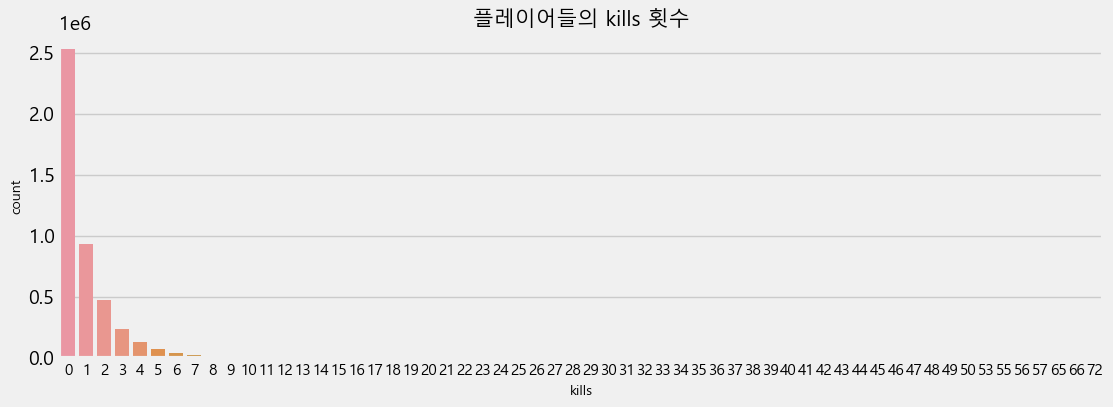
kills 횟수 평균: 0.9247833241810259
해석
- 대부분의 플레이어들은 0킬이고, 적게는 1킬부터 많게는 72킬까지 넓게 분포함
✏️ 플레이어들의 matchDuration 분포
## 플레이어들의 matchDuration(매치지속시간) 분포
plt.figure(figsize=(12,4))
sns.distplot(x=train['matchDuration'], bins=10)
plt.title('플레이어들의 matchDuration 분포')
plt.show()

해석
- 대부분의 플레이어는 1000초 이상 매치를 지속함
✏️ 플레이어들의 teamKills 횟수 분포
## 플레이어들의 팀킬 횟수 분포
plt.figure(figsize=(12,4))
sns.countplot(x='teamKills', data=train)
plt.title('플레이어들의 teamKills 횟수')
plt.ylim([0, 100000])   # y축 범위 제한해서 보기
plt.show()

해석
- 대부분의 플레이어들은 팀킬을 하지 않지만, 1번하는 경우가 8만 건 이상임
- 팀킬을 하는 이유는 다음과 같이 추측해볼 수 있음
- 단순히 재미를 위해
- 팀원이 너무 못해서 (즉, 게임에 도움이 되지 않을 것 같아서...)
✏️ 플레이어들의 longestKill 분포
## 플레이어들의 longestKill 분포
plt.figure(figsize=(12,4))
sns.distplot(x=train['longestKill'], bins=10)
plt.title('플레이어들의 longestKill 분포')
plt.xlim([0, 200])   # x축 범위 제한해서 보기
plt.show()
해석
- 대부분 0~25m 이내에 분포하고 있으나, 간혹 아주 먼 거리에서 죽이는 경우도 존재함 (이상치 제거 필요)
✏️ 플레이어들의 walkDistance 분포
## 플레이어들의 walkDistance 분포
plt.figure(figsize=(12,4))
sns.distplot(x=train['walkDistance'], bins=10)
plt.title('플레이어들의 walkDistance 분포')
plt.show()

해석
- 대부분의 플레이어들은 한 매치 내에서 0~2500m 정도 도보로 이동하지만, 25000m를 넘는 경우도 존재함 (이상치 제거 필요)
✏️ 플레이어들의 rideDistance 분포
## 플레이어들의 rideDistance 분포
plt.figure(figsize=(12,4))
sns.distplot(x=train['rideDistance'], bins=10)
plt.title('플레이어들의 rideDistance 분포')
plt.show()
✏️ 플레이어들의 swimDistance 분포
## 플레이어들의 swimDistance 분포
plt.figure(figsize=(12,4))
sns.distplot(x=train['swimDistance'], bins=10)
plt.title('플레이어들의 swimDistance 분포')
plt.show()

해석
- 대부분의 플레이어들은 수영을 통해 0~500m 정도 이동하지만, 3500m 이상인 경우도 존재함 (이상치 제거 필요)
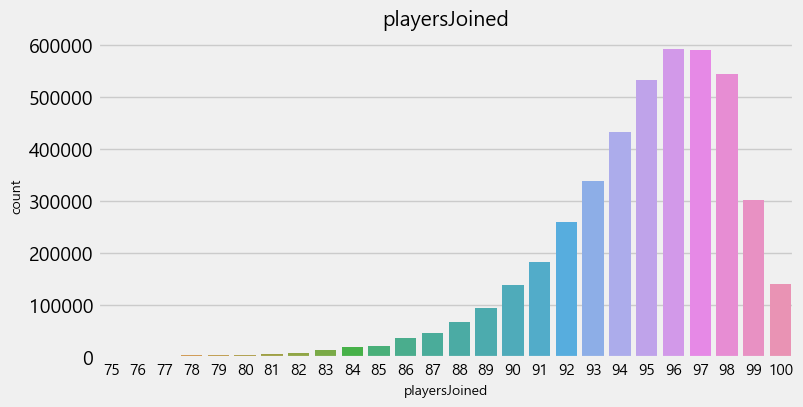
⚡ 한 매치당 몇 명의 플레이어가 참가할까?
- 한 매치에 95~98명의 플레이어가 참가하는 경우가 대부분임
- 매치는 대부분 참가 가능한 최대 플레이어 수 100명이 거의 채워져서 진행되는 편임
# "matchId"별로 playersJoined 계산하여 새로운 컬럼으로 추가
train['playersJoined'] = train.groupby('matchId')['matchId'].transform('count')

# 한 매치에 75명 이상 참가한 경우만 시각화
plt.figure(figsize=(8,4))
sns.countplot(x=train[train['playersJoined']>=75]['playersJoined'])
plt.title('playersJoined')
plt.show()
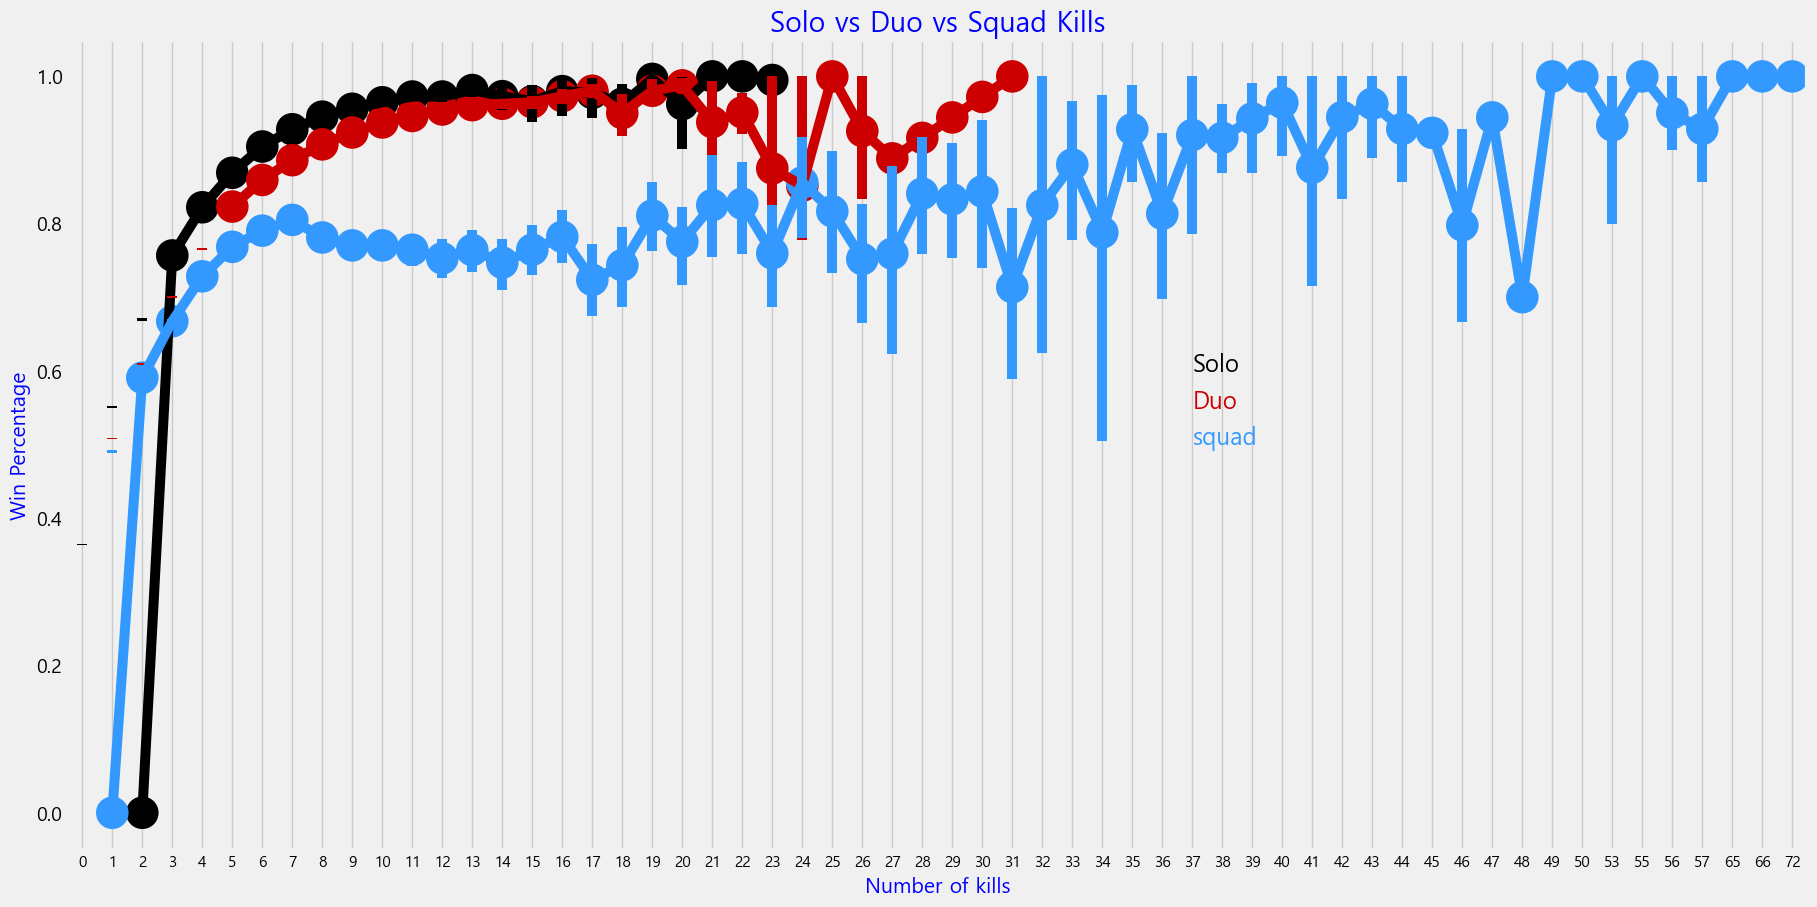
⚡ 솔로/듀오/스쿼드 중 가장 승률이 높은 유형은?
- 대체적으로 솔로, 듀오, 스쿼드 순으로 승률이 높은 편임
# 매치 종류 확인
train['matchType'].value_counts()
# 출력 결과
matchType
squad-fpp 1756186
duo-fpp 996691
squad 626526
solo-fpp 536762
duo 313591
solo 181943
normal-squad-fpp 17174
crashfpp 6287
normal-duo-fpp 5489
flaretpp 2505
normal-solo-fpp 1682
flarefpp 718
normal-squad 516
crashtpp 371
normal-solo 326
normal-duo 199
Name: count, dtype: int64
# "solo", "duo", "squad" 키워드가 포함된 데이터들만 추출
solo = train[train['numGroups'] > 50]
duo = train[(train['numGroups'] > 25) & (train['numGroups'] <= 50)]
squad = train[train['numGroups'] <= 25]

# 그래프 시각화
f,ax1 = plt.subplots(figsize=(20,10))
sns.pointplot(x='kills', y='winPlacePerc', data=solo, color='black')
sns.pointplot(x='kills', y='winPlacePerc', data=duo, color='#CC0000')
sns.pointplot(x='kills', y='winPlacePerc', data=squad, color='#3399FF')
plt.text(37,0.6, 'Solo', color='black', fontsize=17, style='italic')
plt.text(37,0.55, 'Duo', color='#CC0000', fontsize=17, style='italic')
plt.text(37,0.5, 'squad', color='#3399FF', fontsize=17, style='italic')
plt.xlabel('Number of kills', fontsize=15, color='blue')
plt.ylabel('Win Percentage', fontsize=15, color='blue')
plt.title('Solo vs Duo vs Squad Kills', fontsize=20, color='blue')
plt.grid()  # 그리드 표시
plt.show()
⚡ Kill을 많이 할수록 승률이 올라갈까?
- 대부분의 경우 Kill 수가 많을 때 승률 또한 높은 것으로 보임
# kill 횟수와 승률의 산점도
plt.figure(figsize=(6,4))
plt.scatter(x = train['winPlacePerc'], y = train['kills'], color="red", alpha=0.3)
plt.title('kill 횟수와 승률 사이의 산점도')
plt.show()
# kill 횟수 범주별 box plot
kills = train[['kills', 'winPlacePerc']]
kills['killsCategories'] = pd.cut(kills['kills'], [-1, 0, 2, 5, 10, 80], labels=['0 kills','1-2 kills', '3-5 kills', '6-10 kills', '10+ kills'])

plt.figure(figsize=(8,4))
sns.boxplot(x="killsCategories", y="winPlacePerc", data=kills)
plt.show()

(4) 데이터 전처리
⚡ 결측치 처리
- "winPlacePerc"에 결측치 1개 존재 => 확인해본 결과, 오직 한 명의 플레이어만 참가한 경기인 것으로 판단되므로 해당 데이터 제거
# "winPlacePerc"에 결측치 1개 존재
print("결측치 개수:", train['winPlacePerc'].isnull().sum())
# 출력 결과
결측치 개수: 1
# 결측치가 포함된 데이터 확인
train[train['winPlacePerc'].isnull()]
# 결측치 행 제거 후 인덱스 재정렬
train = train.drop(2744604).reset_index(drop=True)
⚡ 파생변수 생성
# 힐 횟수와 부스트 횟수를 더한 파생변수("healsandboosts") 생성
train['healsandboosts'] = train['heals'] + train['boosts']
# 기존변수("heals", "boosts") 제거
train.drop(['heals', 'boosts'], axis=1, inplace=True)
⚡ 이상치 탐색
- totalDistance: 플레이어가 게임 중에 한 번도 움직이지 않으면서 kill 횟수가 1 이상인 경우, 이상치로 판단하고 제거
- roadKills: 로드킬을 10회 이상 실시한 경우, 이상치로 판단하고 제거
- longestKill, walkDistance, rideDistance, swimDistance: 각각1km, 10km, 20km, 2km 이상이면 이상치로 판단하고 제거
## 한 번도 움직이지 않으면서 kill 횟수가 1 이상인 경우 이상치로 판단 후 제거

# 플레이어가 움직인 총 거리를 나타내는 변수 생성 ("totalDistance")
train['totalDistance'] = train['rideDistance'] + train['walkDistance'] + train['swimDistance']

# 이상치 제거
train['killsWithoutMoving'] = ((train['kills'] > 0) & (train['totalDistance'] == 0))
train.drop(train[train['killsWithoutMoving'] == True].index, inplace=True)

# 필요 없는 변수 모두 제거해주기
train.drop(['totalDistance', 'killsWithoutMoving'], axis=1, inplace=True)
## "roadKills"을 10회 이상 실시한 경우 이상치로 판단 후 제거
train.drop(train[train['roadKills'] > 10].index, inplace=True)## "longestKill"가 1km 이상이면 이상치로 판단하고 제거
train.drop(train[train['longestKill'] >= 1000].index, inplace=True)
## Distance가 각각 10km, 20km, 2km 이상이면 이상치로 판단하고 제거
train.drop(train[train['walkDistance'] >= 10000].index, inplace=True)
train.drop(train[train['rideDistance'] >= 20000].index, inplace=True)
train.drop(train[train['swimDistance'] >= 2000].index, inplace=True)
# 이상치를 모두 제거하고 남은 데이터 개수
train.shape
# 출력 결과
(4445024, 29)
⚡ 범주형 변수 인코딩
- matchType: 원핫인코딩
- groupId, matchId: category형으로 변환 (group과 match 간 상관관계 활용)
## "matchType": 원핫인코딩
train = pd.get_dummies(train, columns=['matchType'])

# boolean(True/False)를 int(0,1)로 변환
train[train.columns[27:]] = train[train.columns[27:]].astype(int)
## "groupId", "matchId": category형으로 변환 후 숫자값으로 인코딩
train['groupId'] = train['groupId'].astype('category')
train['matchId'] = train['matchId'].astype('category')
train['groupId_cat'] = train['groupId'].cat.codes
train['matchId_cat'] = train['matchId'].cat.codes

# 기존 변수 제거
train.drop(['groupId', 'matchId'], axis=1, inplace=True)

# 인코딩이 잘 되었는지 확인
train[['groupId_cat', 'matchId_cat']].head()
⚡ 필요 없는 변수 제거
## 플레이어의 ID 컬럼 제거
print("Id 고유값 개수:", train['Id'].nunique())
train.drop("Id", axis=1, inplace=True)
# 출력 결과
Id 고유값 개수: 4445024(5) 학습 및 평가
## 머신러닝을 위한 패키지
from sklearn.metrics import mean_absolute_error
from sklearn.ensemble import RandomForestRegressor
## 디버깅을 위한 샘플링
sample = 500000
df_sample = train.sample(sample)
## target 변수 따로 저장
y = df_sample['winPlacePerc']
df = df_sample.drop('winPlacePerc', axis=1)
⚡ 검증을 위한 데이터 분리
## train, valid 데이터 분리하는 함수 생성
def split_vals(a, n:int):
    return a[:n].copy(), a[n:].copy()
val_perc = 0.12
n_valid = int(val_perc * sample)
n_trn = len(df) - n_valid

# Split
raw_train, raw_valid = split_vals(df_sample, n_trn)
X_train, X_valid = split_vals(df, n_trn)
y_train, y_valid = split_vals(y, n_trn)
# 확인
print('train:', X_train.shape, 'target:', y_train.shape, 'validation:', X_valid.shape)
# 출력 결과
train: (440000, 42) target: (440000,) validation: (60000, 42)
⚡ 평가 지표(MAE)
## 성능 평가 지표(MAE) 출력하는 함수 생성
def print_score(m: RandomForestRegressor):
    res = ['mae train:', mean_absolute_error(m.predict(X_train), y_train),
           'mae val:', mean_absolute_error(m.predict(X_valid), y_valid)]
    if hasattr(m, 'oob_score_'): res.append(m.oob_score_)
    print(res)
⚡ Basic RF Model 1
## Basic model 학습
rf = RandomForestRegressor(n_estimators=50,
                           min_samples_leaf=3,
                           max_features='sqrt',
                           n_jobs=-1)
rf.fit(X_train, y_train)
print_score(rf)
# 출력 결과
['mae train:', 0.041673329186753184, 'mae val:', 0.06266519503048588]
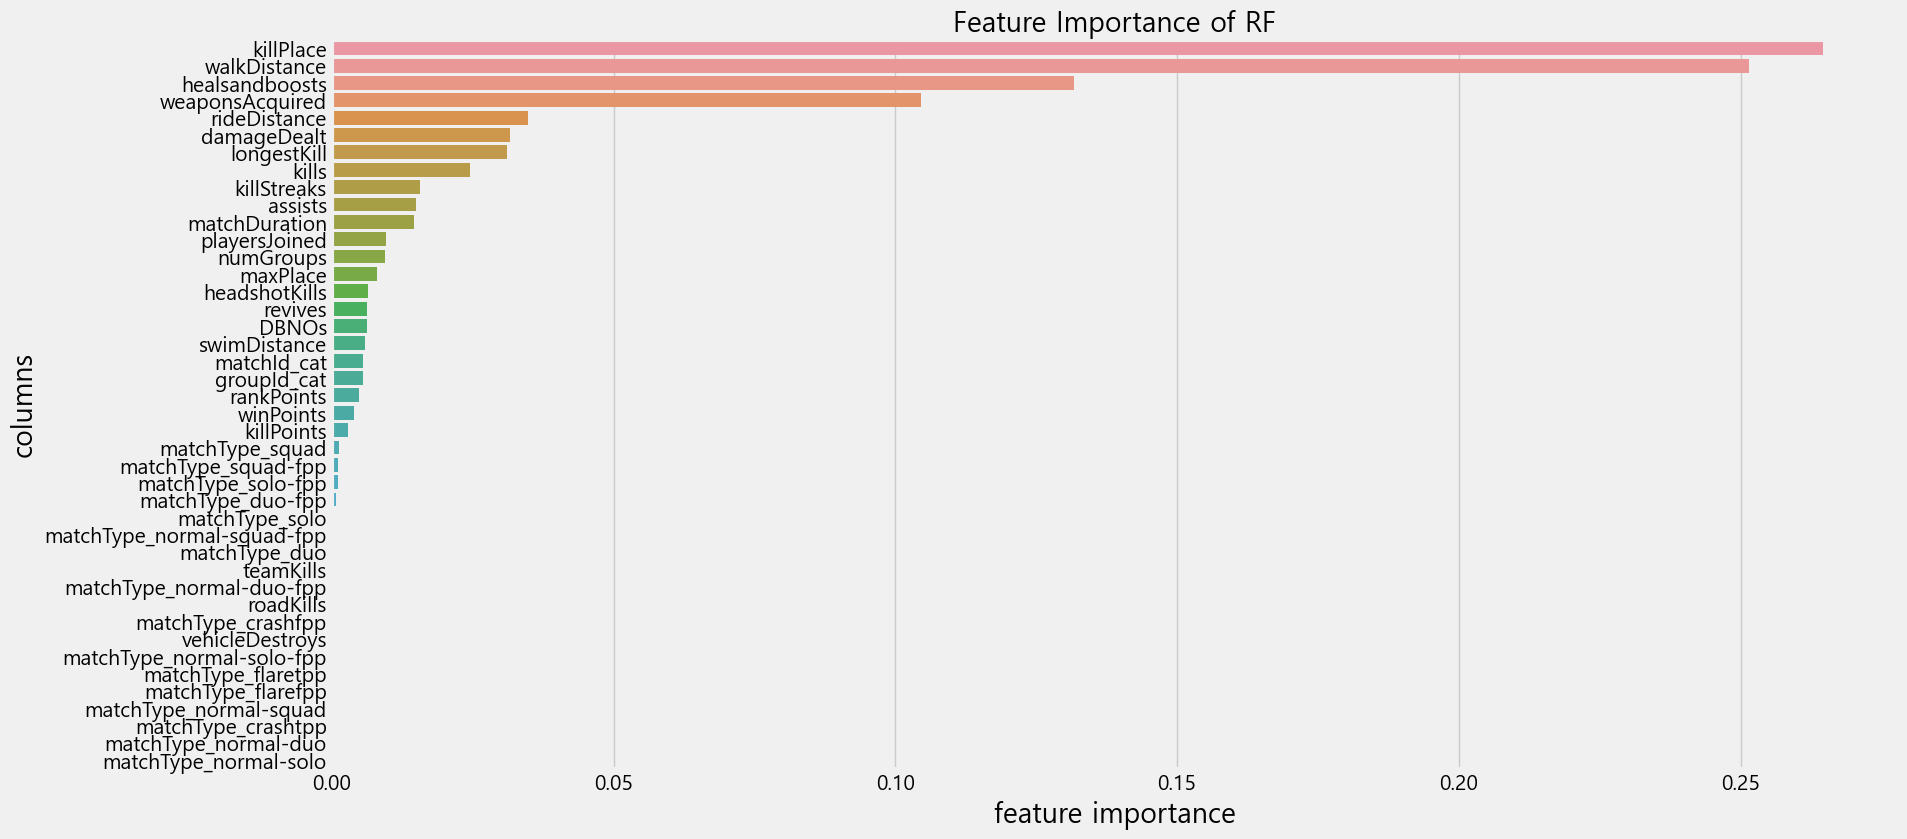
⚡ Feature Importance
## Basic model의 변수중요도 확인
rf_feature_importance = pd.DataFrame(rf.feature_importances_, X_train.columns, columns=['Feature Importance'])
# 변수중요도 순서로 오름차순 정렬
rf_feature_importance = rf_feature_importance.sort_values('Feature Importance', ascending=False)

# 변수중요도 시각화
plt.figure(figsize=(18,9))
sns.barplot(x='Feature Importance', y=rf_feature_importance.index, orient='h', data=rf_feature_importance)
plt.title("Feature Importance of RF", size=20)

plt.xticks(size=15)
plt.yticks(size=15)
plt.xlabel('feature importance', size=20)
plt.ylabel('columns', size=20)
plt.show()
⚡ RF Model 2
- 파라미터 조정: n_estimators 값 50 -> 80
## 파라미터 조정 후 학습
rf2 = RandomForestRegressor(n_estimators=80,
                           min_samples_leaf=3,
                           max_features='sqrt',
                           n_jobs=-1)
rf2.fit(X_train, y_train)
print_score(rf2)
# 출력 결과
['mae train:', 0.04123858030265405, 'mae val:', 0.06211411133651147]
## Basic model의 변수중요도 확인
rf_feature_importance2 = pd.DataFrame(rf2.feature_importances_, X_train.columns, columns=['Feature Importance'])
# 변수중요도 순서로 오름차순 정렬
rf_feature_importance2 = rf_feature_importance2.sort_values('Feature Importance', ascending=False)

# 변수중요도 시각화
plt.figure(figsize=(18,9))
sns.barplot(x='Feature Importance', y=rf_feature_importance2.index, orient='h', data=rf_feature_importance2)
plt.title("Feature Importance of RF", size=20)

plt.xticks(size=15)
plt.yticks(size=15)
plt.xlabel('feature importance', size=20)
plt.ylabel('columns', size=20)
plt.show()

⚡ 상관관계
## Feature Importance > 0.05인 변수들만 추출
df_keep = df[rf_feature_importance2[rf_feature_importance2['Feature Importance'] > 0.05].index].copy()
X_train, X_valid = split_vals(df_keep, n_trn)
## 히트맵으로 상관관계 확인
corr = df_keep.corr()
plt.figure(figsize=(10, 7))
sns.heatmap(corr, cmap="Greens", annot=True, linewidths=0.5, fmt=".3f", cbar = True)
plt.show()

(6) 최종 RF Model
## train, valid data 분리
val_perc_full = 0.2
n_valid_full = int(val_perc_full * len(train))
n_trn_full = len(train) - n_valid_full

# X, y 분리
y = train['winPlacePerc']
df_full = train.drop('winPlacePerc', axis=1)
# df_full = df_full[to_keep]

# Split
X_train, X_valid = split_vals(df_full, n_trn_full)
y_train, y_valid = split_vals(y, n_trn_full)

# 확인
print('train:', X_train.shape, 'target:', y_train.shape, 'validation:', X_valid.shape)
# 출력 결과
train: (3556020, 42) target: (3556020,) validation: (889004, 42)
## 최종 RF Model 학습
rf_final = RandomForestRegressor(n_estimators=80,
                                 min_samples_leaf=3,
                                 max_features='sqrt',
                                 n_jobs=-1)
rf_final.fit(X_train, y_train)
print_score(rf_final)
# 출력 결과
['mae train:', 0.0394811623200244, 'mae val:', 0.058680613710969526]
참고 자료
Kaggle | PUBG Data Exploration + RF (+ Funny GIFs)
분석 코드
'Data Analysis' 카테고리의 다른 글
| [Dacon/python] 제주도 도로 교통량 예측 프로젝트 (0) | 2023.08.24 |
|---|---|
| [kaggle/python] House Price prediction (0) | 2023.08.24 |
| [kaggle/python] House Price exploration (0) | 2023.08.23 |
| [kaggle/python] titanic 생존 여부 예측 (0) | 2023.08.23 |
'Data Analysis' Related Articles
more


